Trade Statistics


Notes:
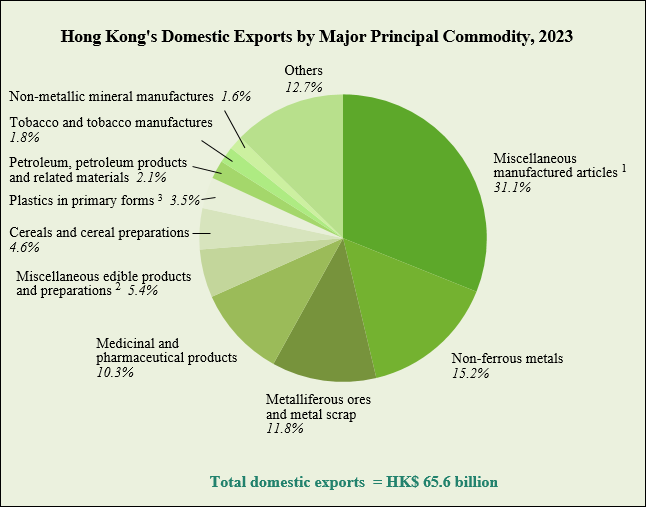
Sum of percentage shares shown in the chart may not add up to 100% due to rounding.
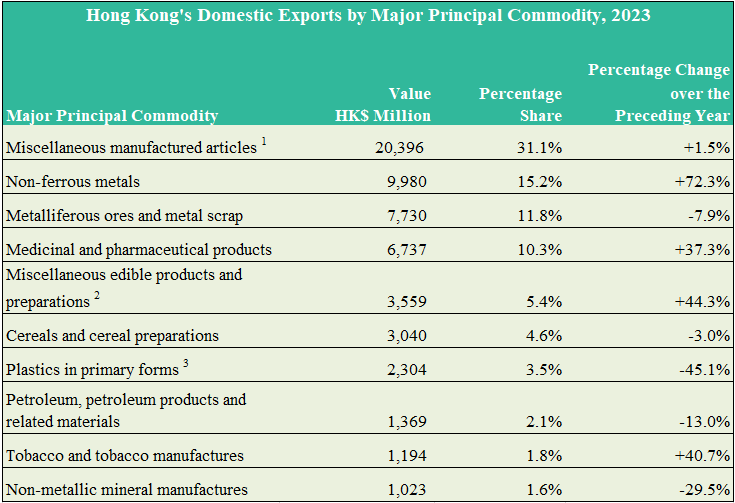
1 Among "miscellaneous manufactured articles", percentage share of "jewellery, goldsmiths' and silversmiths' wares, and other articles of precious or semi-precious materials" in Hong Kong's domestic exports in 2023 was the largest (28.6%).
2 Among "miscellaneous edible products and preparations", percentage share of "edible products and preparations (other than margarine and shortening)" in Hong Kong's domestic exports in 2023 was the largest (5.4%).
3 "Plastics in primary forms" and "plastics in non-primary forms" together accounted for 4.0% of Hong Kong's domestic exports in 2023.
Source: Census and Statistics Department


